Our financial performance
At Independence Blue Cross, walking the talk financially means providing the resources that are essential to fulfilling our mission — enhancing the health and wellness of the people and communities we serve — and to fueling our ability to continue exceeding our customers' expectations.
After financial losses in 2008 and 2009, we produced positive results in 2010 and 2011. Returning to profitability over the past two years has been critical for our company to remain financially stable, invest in better serving our customers, and prepare for the changes that federal health care reform brings. Over the last five years, which includes four years of economic uncertainty, our net income margin averaged 1.1 percent.
Consolidated Balance Sheets
December 31, 2011, and December 31, 2010 ($ in thousands)| 2011 | 2010 | |
| Cash and investments | $3,278,151 | $2,657,093 |
| Premiums and other receivables | 1,262,936 | 1,162,959 |
| Intangibles and other assets | 805,898 | 675,923 |
| Total assets | $5,346,985 | $4,495,975 |
| Claim liabilities | 1,611,199 | 1,166,069 |
| Unearned income | 550,832 | 584,580 |
| Accrued expenses | 567,994 | 380,857 |
| Other liabilities | 368,543 | 544,627 |
| Total liabilities | $3,098,568 | $2,676,133 |
| Independence Blue Cross surplus | 2,106,619 | 1,819,842 |
| Noncontrolling interest surplus | 141,798 | - |
| Total surplus | $2,248,417 | $1,819,842 |
| Total liabilities and surplus | $5,346,985 | $4,495,975 |
Consolidated Statements of Operations
December 31, 2011, and December 31, 2010 ($ in thousands)| 2011 | 2010 | |
| Premium revenue | $8,876,219 | $9,337,784 |
| Management services & other revenue | 335,318 | 325,275 |
| Total revenue | $9,211,537 | $9,663,059 |
| Claims incurred | 7,711,901 | 8,266,724 |
| Operating expenses | 1,138,217 | 1,126,606 |
| Total expenses | $8,850,118 | $9,393,330 |
| Net operating income (loss) | $361,419 | $269,729 |
| Investment and other income | 138,061 | 127,361 |
| Restructuring costs and other income/expense | (10,510) | (109,247) |
| Net income (loss) before taxes | $488,970 | $287,843 |
| Income tax benefit (expense) | (177,643) | (77,038) |
| Discontinued operations, net of tax | 3,476 | 372 |
| Net income (loss) | $314,803 | $211,177 |

Unlike publicly traded health insurance companies, we do not have to use our net income to reward stockholders. Rather, we use our net income to:
- respond to our customers' needs for new products and services;
- continually improve our already high level of service;
- invest in technology to speed and simplify doing business with us;
- support initiatives to enhance the health of the community.
Maintaining financial stability
To achieve positive results, we continued to strengthen our performance in three critical areas:
- enhancing our core health insurance business with innovative products and services;
- investing in our company to modernize and become more efficient;
- managing our business with fiscal discipline.
In 2011, we also focused on offering new capabilities and services to our customers, improved the quality of our members' care, attracted new customers,reduced operating costs, and worked collaboratively with other Blue health insurers on strategic initiatives. For example, we partnered with Blue Cross Blue Shield of Michigan to purchase one of the country's largest Medicaid companies, AmeriHealth Mercy Family of Companies, an investment that will expand services to Medicaid beneficiaries nationally through this top-tier Medicaid managed care organization headquartered in Philadelphia.
Unlike publicly traded health insurance companies, we do not have to use our net income to reward stockholders. Rather, we use our net income to respond to our customers' needs for new products and services, continually improve our already high level of service, invest in technology to speed and simplify doing business with us, support initiatives to enhance the health of the community, and maintain an adequate surplus to weather serious financial downturns or medical crises such as epidemics or natural disasters.
Maintaining our financial health allows us to continue to serve our customers in tough economic times and invest for the future. With sound fiscal management and positive performance, we're walking the talk for the 3.1 million members who depend on us.
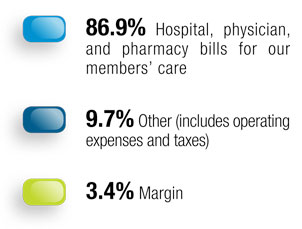
Your premium dollar and how it's spent
We spent 86.9 cents of each premium dollar on our members' health care in 2011. We used 9.7 cents to run our business and pay taxes. We paid $210.4 million in federal, state, and local nonpayroll taxes in 2011, including $39.2 million in state premium taxes.